
So, what happened during the stay at home orders? Supply and demand were restricted since consumers went to the sidelines due to covid-19. Interest rates declined to the low threes. Inventory is at the lowest level in the past 15 years with prices at record highs. We are only seeing about 25% of homes take a price reduction before they sell.
While forbearance requests are declining, mortgages in forbearance are rising. According to the Mortgage Bankers Association as of May 18th, 8.16% total loans are in forbearance which comprise 4.1 million homeowners.
Now for the stats:
Buyers can pick from 10,167 homes that are available in Chester, Delaware, Montgomery & Philadelphia Counties.
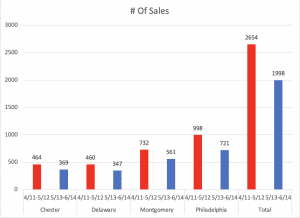
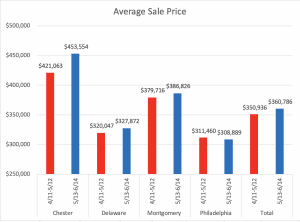
These four counties had 25% fewer transactions than the prior month. However, they averaged about 3% in price appreciation over the prior month with all counties showing gains except Philadelphia which lost $2,571 in value over the prior month. Could the Philadelphia decline be related to Suburbanization?
What does all this really mean? How can real estate do so well in the middle of a pandemic with unemployment running at 13.3% as of May, retail devastation & other economic challenges. While this data would be contrary to what you would think it’s because we are experiencing a health crisis not a housing crisis.
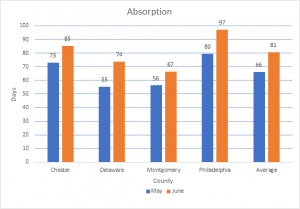
We are still in a sellers’ market based upon very low absorption. The absorption went from 66 days in May to 81 days in June. This is my barometer to measure how the market is doing. I perform this analysis for every single property that we list for sale. This data is critical before you can discuss a price strategy you must understand this analytic.
The best way to figure out what is happening with the real estate market is to examine shadow inventory. Shadow inventory is broadly defined as homes that are temporarily off the market.
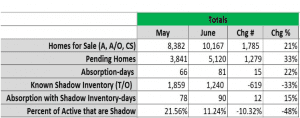
We have identified 1,859 shadow inventory homes pulled from the market in May. The category decreased by 33% to 1,244 homes in June. This is clearly a signal that home sellers are getting more comfortable selling their home during covid-19. Even if the remaining 1,244 shadow homes came on the market it would have a minimal effect on absorption since it would change from 81 to 90 days.
So what does all this mean:
Buyers will benefit from low interest rates but may have challenges finding a home.
Sellers will benefit from increased pricing and minimal competition all due to my barometer that we previously discussed known as absorption.
Historically a house in the US costs around 3 to 4 times the median annual income. During the housing bubble of 2007 the ratio surpassed 5 – in other words, the median price for a single family home in the United States cost more than 5 times the US median annual household income. The spread between incomes and housing prices is starting to grow closer to the last bubble. This is another Déjà vu sign that an offer today may be worth more than an offer tomorrow. I would like to leave you with one question: Does this spark your memory of something we previously saw in 2007?
Stay safe, practice social distancing and watch next month’s market report.