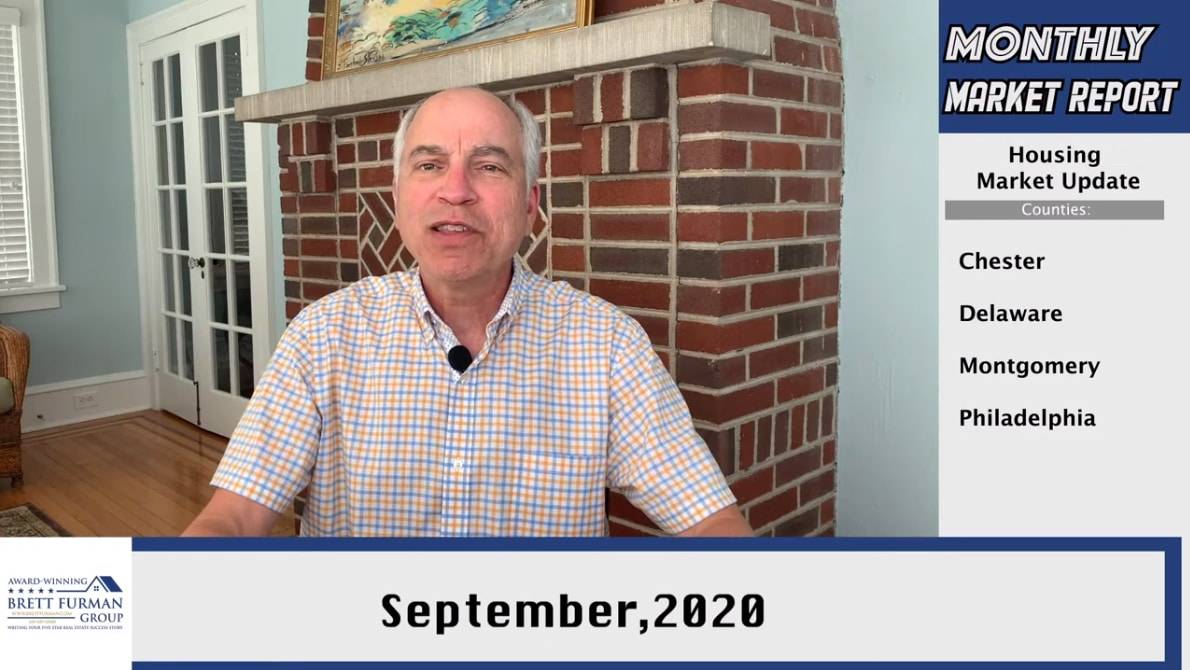
Hi! Brett Furman from the Brett Furman Group to present the monthly marketing report for Chester, Delaware, Montgomery & Philadelphia Counties.
The market has continued to roar and certainly not what you would expect during a pandemic. We continue to see multiple-offer situations by competing buyers who are willing to waive inspection contingencies and committing to make up the difference between the purchase price and appraised value if the appraisal comes up short.
I am watching lots of exciting new real estate trends emerge from the corona virus pandemic including buyers seeking zoom rooms, parents that are looking for virtual home school learning space, buyers that want swimming pools and other home exercise amenity space. I am noticing buyers that are migrating away from dense urban areas in favor of suburban locations due to companies switching workers to remote working. A recent report from Home Depot shows sales soaring amid the pandemic as people invest in DIY projects rather than spend money at restaurants and on vacations.
What’s driving the real estate market right now? Supply & Demand. We have limited supply and strong demand. This is all being driven by lifetime low interest rates under three percent.
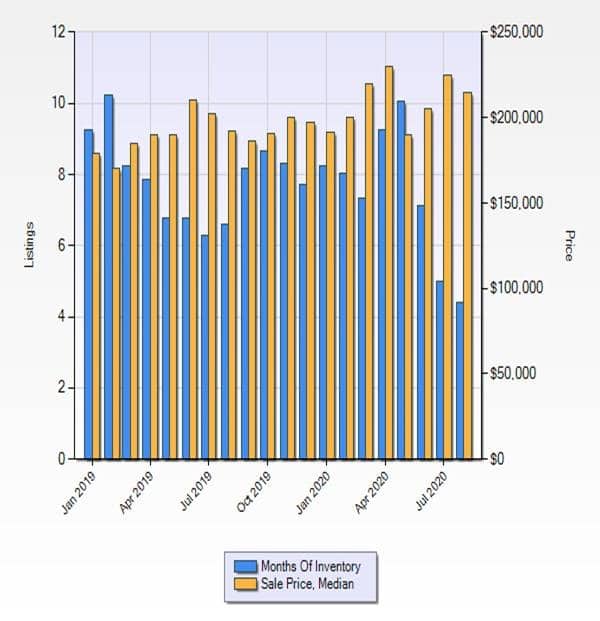
The best way to understand the housing market is to examine absorption and pricing and carefully watch for trends. Starting with Philadelphia you will note that during July and August it is taking twice as long for the market to absorb the inventory versus its suburban counter parts of Chester, Delaware and Montgomery County. In addition, Philadelphia housing prices declined in the months of July & August which is in stark contrast to the suburban counterparts that showed housing gains. Could this be related to suburban migration?
The counties of Chester, Delaware and Montgomery show that the number of days it takes the market to absorb or sell inventory continues to decrease and housing pricing are rising.
The below Philadelphia graph is from Jan 2019 to Aug 2020. Results calculated from approximately 87,000 listings.
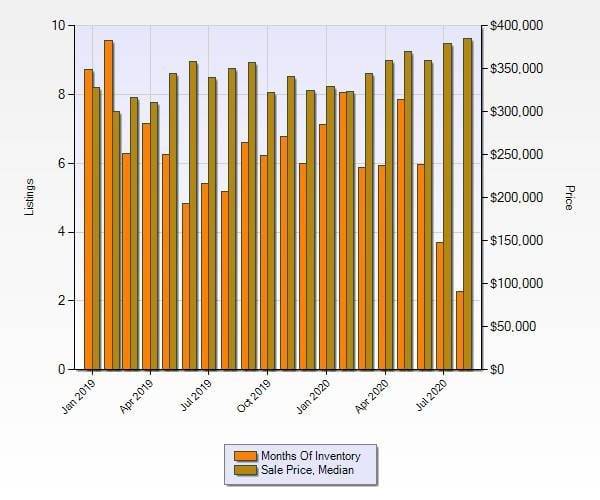
Next is Chester County. This suburban county is showing that it is taking the market half the rate of Philadelphia to absorb inventory and limited price growth in both July and August.
The below Chester County graph is from Jan 2019 to Aug 2020, Results calculated from approximately 23,000 listings.
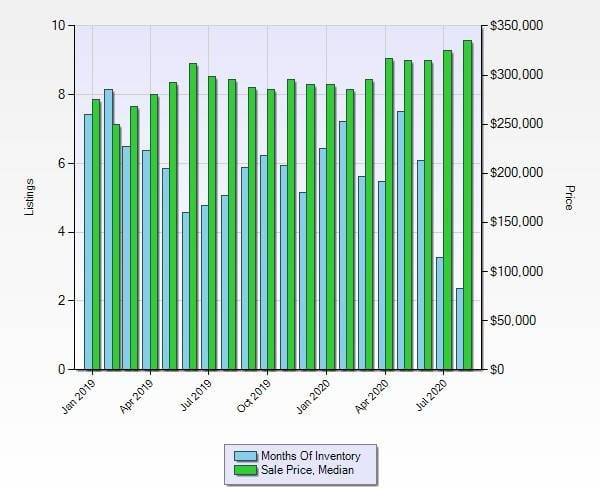
Montgomery County mimicked Chester & Delaware County.
The below Montgomery County graph is from Jan 2019 to Aug 2020. Results calculated from approximately 34,000 listings.
What does all this data really mean?
Historically a house in the US costs around 3 to 4 times the median annual income. During the housing bubble of 2008 the median price for a single-family home in the United States cost more than 5 times the US median annual household income. 2020 is starting to feel much like 2008 as housing prices are peaking and incomes are flattening.
I have been fortunate to be involved in the real estate industry for over 35 years and have watched many real estate cycles come and go. My prediction is that the market will start shifting in 2021, but we will not see the magnitude of foreclosures and shorts sales like in 2008 for the following three reasons:
- Homeowners have record equity which they did not have in 2008.
- Higher lending standards including stringent documentation and appraisal standards.
- Coronavirus Aid, Relief, and Economic Security (CARES) Act – which produced two housing safeguards:
- The first safeguard is a foreclosure moratorium thru 12/31/20 for Federal, Fannie & Freddy loans.
- The second safeguard is a forbearance for anyone experiencing financial hardship due to the corona pandemic up to 180 days.
Thanks for watching this month’s market report.
Stay safe, practice social distancing, and watch next month’s market report.
Make sure you subscribe to our YouTube channel so you can continue to get these updates.

